
Debugging in Node Using Chrome Devtools
As I'm writing this the current Node version is 16.13. Debugging in NodeJS is a good trick to know how to do when you’re a web developer. It is done by adding simply -- inspect flag. What happens is that when using -- inspect flag Node opens a port to accept WebSocket connections. Now you will be presented with the following: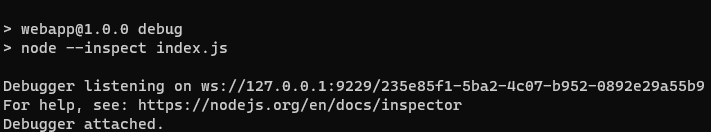
node --inspect snippet
Once successful, now open up Google Chrome and type the following URL chrome :// inspect /# devices . This will present you with a DevTools webpage that allows you to debug your node project. Click Configure… which should open up a window in which you can see the discoverable ports on your PC. You should now see a remote target added to your DevTools dashboard. Click inspect and a new window should appear.
One problem I had was getting the file to appear. In order to get it to appear I have to find the file by using CTRL-P and searching for the file. The location of mine was at the end of the list. Now you can debug away by adding breakpoints and running your application. While debugging you can hover over various variables in your code to find the problem. You will also notice arrows for stepping in and out of functions that are very useful.
Setting up Stack Trace
The basics behind displaying stack trace is simple in node. All one would have to do is.